| ||||||||||||||||||
| ||||||||||||||||||
| ||
| State park used by the Albany Area Amateur Astronomers for star parties. | ||
| Page Contents | |||||
| |||||
| |||||
| Nifty Links: | |||||
| Near-Realtime Satellite Imagry of Clouds | Sun & Moon Data | Road Map | Topo Map | Civil Weather | Satellites: Predictions Live Map |
| Star Maps: heavens-above fourmilab |
|
What is it? |
Created by Attilla Danko, it's the astronomer's forecast. At a glance, it shows when it will be cloudy or clear for the next few days. It's a prediction of when Grafton Lakes State Park, NY, will have good weather for astronomical observing. (Not my observatory.)
The data comes from a forecast model developed by Allan Rahill of the Canadian Meteorological Centre. CMC's numerical weather forecasts are unique because they are specifically designed for astronomers. But they have 1180 forecast maps. It can be a chore to find the one map that tells you if you can observe tonight.
So, Attilla Danko wrote a script to generate the images like the one above which summarizes CMC's forecast images just for Grafton Lakes State Park and the surroundings out to about 10 miles.
There are charts for 6178 locations.
How do I read it? |
Details: Read the image from left to right. Each column represents a different hour. The colors of the blocks are the colors from CMC's forecast maps for that hour. The two numbers at the top of a column is the time. A digit 1 on top of a 3 means 13:00 or 1pm. It's local time, in 24hr format. (Local time for Grafton Lakes State Park is -4.0 hours from GMT.) Single blocks mean separate forecast data for each hour. Connected blocks mean one forecast calculation for several hours.
Cloud Cover |
| Overcast | 90% covered | 80% covered | 70% covered | 60% covered | 50% covered | 40% covered | 30% covered | 20% covered | 10% covered | Clear |
Accuracy averaged over North America for a 30 day period: when the forecast is predicting less than 12 hours into the future, mostly-clear forecasts (cloud<25%) have been right 80% of the time. Mostly-cloudy forecasts (cloud>75%) have been right 91% of the time. When the forecast is predicting 36 to 48 hours into the future, the mostly-clear accuracy is 76% and the mostly-cloudy accuracy is 89%. Accuracy beyond 48 hours in unknown.
It's always wise to click on a colored block for the hour you want to observe and see if your location is close to a cloud edge.
CMC's text page explaining this forecast is here.
Transparency |
| Too cloudy to forecast | Poor | Below Average | Average | Above average | Transparent |
The line, labeled Transparency, forecasts the transparency of the air. Here 'transparency' means just what astronomers mean by the word: the total transparency of the atmosphere from ground to space. It's calculated from the total amount of water vapor in the air. It is somewhat independant of the cloud cover forecast in that there can be isolated clouds in a transparent air mass, and poor transparency can occur when there is very little cloud.
Above average transparency is necessary for good observation of low contrast objects like galaxies and nebulae. However, open clusters and planetary nebulae are quite observable in below average transparency. Large globulars and planets can be observed in poor transparency.
A forecast color of white formally means that CMC didn't compute the transparency forecast because the cloud cover was over 30%. So it may be possible to observe during a white transparency forecast, but the real transparency is usually yucky. This forecast does not consider smoke. So see the separate smoke forecast line on this chart.
CMC's text page explaining the transparency forecast is here.
Seeing |
| Too cloudy to forecast | Bad 1/5 | Poor 2/5 | Average 3/5 | Good 4/5 | Excellent 5/5 |
Bad seeing can occur during perfectly clear weather. Often good seeing occurs during poor transparency. It's because seeing is not very related to the water vapor content of the air.
The excellent-to-bad seeing scale is calibrated for instruments in the 11 to 14 inch range. A detailed explanation of the seeing catagories, both descriptive and an arcsecond scale, is on CMC's Seeing Forecast for astronomical observations page.
No computer model forecasts convective heating well, so consider the seeing forecasts for daytime hours to be less accurate. Seeing is forecast for 3-hour blocks, so triples of seeing blocks will show the same color. Those triplet boxes for the same forecast map are showen linked as a reminder. A white block on the seeing line means that there was too much cloud (>80% cover) to calculate it.
Note also that you may observe worse seeing though your telescope than what a perfect seeing forecast would predict. That is because tube currents and ground seeing mimic true atmospheric seeing. You may also observe better seeing than predicted here when observing with an instrument smaller than 11 inches.
This video discusses the difference bettween tube currents and seeing from 24:23 to 34.06: on youtube.
Darkness |
| -4 | -3 | -2 | -1 | 0 | 1.0 | 2.0 | 3.0 | 3.5 | 4.0 | 4.5 | 5.0 | 5.5 | 6.0 | 6.5 |
It is based on Ben Sugerman's Limiting Magnitude calculations page. It takes into account the sun's and moon's position, moon phase, solar cycle and contains a scattering model of the atmosphere. It doesn't consider light pollution, dust, clouds, snow cover or the observer's visual acuity. So your actual limiting magnitude will often be different.
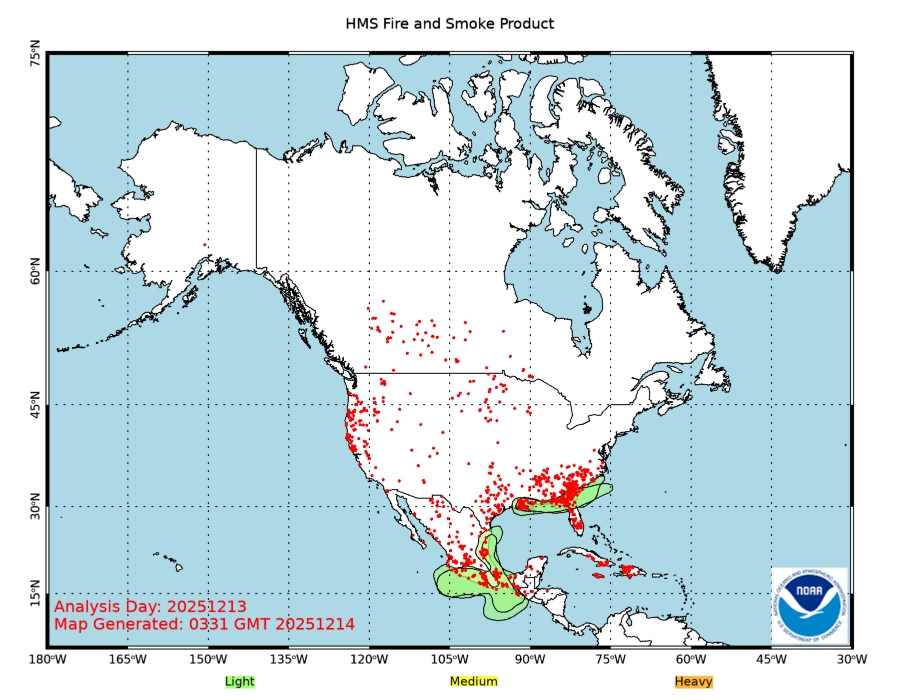
Smoke |
| No Smoke | 2ug/m^3 | 5ug/m^3 | 10ug/m^3 | 20ug/m^3 | 40ug/m^3 | 60ug/m^3 | 80ug/m^3 | 100ug/m^3 | 200ug/m^3 | 500ug/m^3 |
A note about CMC's smoke forecast colors: The chart shows different colors than the corresponding CMC maps because the maps use white to mean "no smoke" but the cloud and transparency forecasts use white to mean "opaque sky". I've chosen colors for the lowest levels to suggest sky colors. But the EPA has set a limit for 24hr exposure of 35 micrograms per cubic meter. So I have colored levels with more smoke than that with red colors and the worst with brown. People should look for air quality warnings from their local health authorities if the smoke line shows red blocks. If the smoke line shows brown blocks, I'd stay indoors.
The smoke data on the chart comes from Environment Canada's Canada's Wildfire Smoke Prediction System.
Wind |
| >45 mph | 29 to 45 mph | 17 to 28 mph | 12 to 16 mph | 6 to 11 mph | 0 to 5 mph |
Humidity |
| <25% | 25% to 30% | 30% to 35% | 35% to 40% | 40% to 45% | 45% to 50% | 50% to 55% | 55% to 60% | 60% to 65% | 65% to 70% | 70% to 75% | 75% to 80% | 80% to 85% | 85% to 90% | 90% to 95% | 95% to 100% |
Humidity variations can indicate the likelihood of optics and eyepieces dewing.
But dewing is not simply correlated to relative humidity. Dewing tends to happen when the sky is clear, the temperature is dropping and there isn't much wind. Being on a hilltop or in a small valley can make the difference between no dew and dripping telescopes. Unfortunately, the humidity forecast does not have the spatial resolution to know about small hills, valleys, or observatory walls. All of which can reduce dewing.
A sudden spike in the humidity forecast, an hour or so after the cloud forecast predicts a sudden transition from cloudy to clear, when there is no wind, means that ground fog will form.
Also, when the cloud forecast is opaque and the humidity forecast is 95%, rain is likely: a good time to cover the telescopes.
Since there are many different levels in this forecast, with similar looking colors, it's best to activate the "explain colors when you mouse over" to interpret the colors.
Temperature |
| < -40F | -40F to -31F | -30F to -21F | -21F to -12F | -12F to -3F | -3F to 5F | 5F to 14F | 14F to 23F | 23F to 32F | 32F to 41F | 41F to 50F | 50F to 59F | 59F to 68F | 68F to 77F | 77F to 86F | 86F to 95F | 95F to 104F | 104F to 113F | >113F |
Cold temperatures also mean reduced battery capacity, stiffer lubricants, stiffer electrical cables and slower LCD displays. Camera sensors will have reduced noise. But, in general, electronics have a lowest temperature at which they will work.
How do I see the full maps? |
To see CMC's full map for a particular hour, click on a colored block. The CMC map your browser will load will be the map closest to the hour you picked. The time on the CMC map might look odd because it's in GMT, while the blocks on the chart are in local time.
It's worth checking a few of the full maps before committing to a long drive out to an observing site.
May I put the Chart on my web page? |
Or, if you would prefer a simplified thumbnail:
But please don't copy other html or text from this page.
Hey, this is cool. How do I make sure I keep getting it? |
Use it. Attilla Danko intends to keep updating this image for as long people use it and as long as CMC is willing to generate the underlying maps. But there are ways that you can help:
If you find this clear sky chart, or CMC maps linked by the colored blocks, useful please send Allan Rahill of the CMC an email (and feel free to copy me). Allan created these forecasts and would appreciate hearing that they are used.
You can also help keep clear sky charts free for everyone by being a sponsor. Please feel free to tell sponsors that they're cool.